
Dealer sees exponential Improvement with a new, custom website.
For used car dealerships, your website is more than just a virtual storefront—it’s your hardest-working, 24/7 salesperson. Unlike your human sales team, it doesn’t take breaks, vacations, or call in sick. But here’s the catch—just like any salesperson, it has to perform to deliver results.
This article will guide you through why your website is essential to your dealership’s success and how to ensure it’s working for you, not against you. It will outline a case study of a dealer who improved overall marketing performance by addressing the often overlooked culprit: a weak website.
Why Your Website is Your Most Important Sales Tool
Today’s car buyers spend nearly 13 hours researching their vehicle purchase online, with 72% using a mobile device during the process. If your website isn’t optimized to meet their needs, you may be losing sales before potential customers even walk through your door.
Here’s why a top-performing website matters:
- First Impressions Count: Over 75% of customers judge a business’s credibility based on its website.
- Lead Generation Powerhouse: A high-performing website can capture leads through forms, calls-to-action, and live chat, feeding your sales pipeline around the clock.
- Lower Ad Spend: Your website performance is paramount to gaining organic traffic and keeping your Google Ad spend low.
Simply put, your website isn’t just a place to list your cars—it’s the digital front line of your dealership’s sales process and can lead to more significant margins by reducing ad spend.
Let’s take a real-world example of how one dealership in Alabama turned things around with the right website strategy.
A buy-here-pay-here operator in Alabama was receiving marketing services from The Dream Team Media Company starting in February 2024. The services included Google Ads management and Social Media Marketing, which included Facebook Advertising. Digital marketing and advertising performance relies heavily on website performance, making this case the ideal example to illustrate this point.
In July 2024, we observed a significant change in Google Ads performance. We decided to stop paid search ads and focus on social media, where activity was booming. The dealership’s owner indicated that the lead volume started to drop off at the end of July, when we turned the ads off. The first thought anyone would have would be to turn the ads back on. However, turning the ads back on did not improve the significant change in website traffic. We investigated further.

Diagnosing the Real Issue: Website and Server Failures
We looked into their Google Analytics data and found that website traffic had significantly dropped. However, it didn’t drop until a month after we stopped Google Ads, and the most significant drop in traffic was from organic search. This led us to investigate the website’s performance.

Ultimately, we discovered a server problem where the dealer’s website was not served to all devices and browsers. This explained why Google Ads’ performance suffered. After a few more months of trying to get their website provider to fix the issue, without success, we began to build our tested and proven mobile-first, high-performing website for this dealer. Since this dealer provides in-house lending opportunities, we opted for a finance-focused website design with custom content and out-of-the-box SEO for maximum performance.
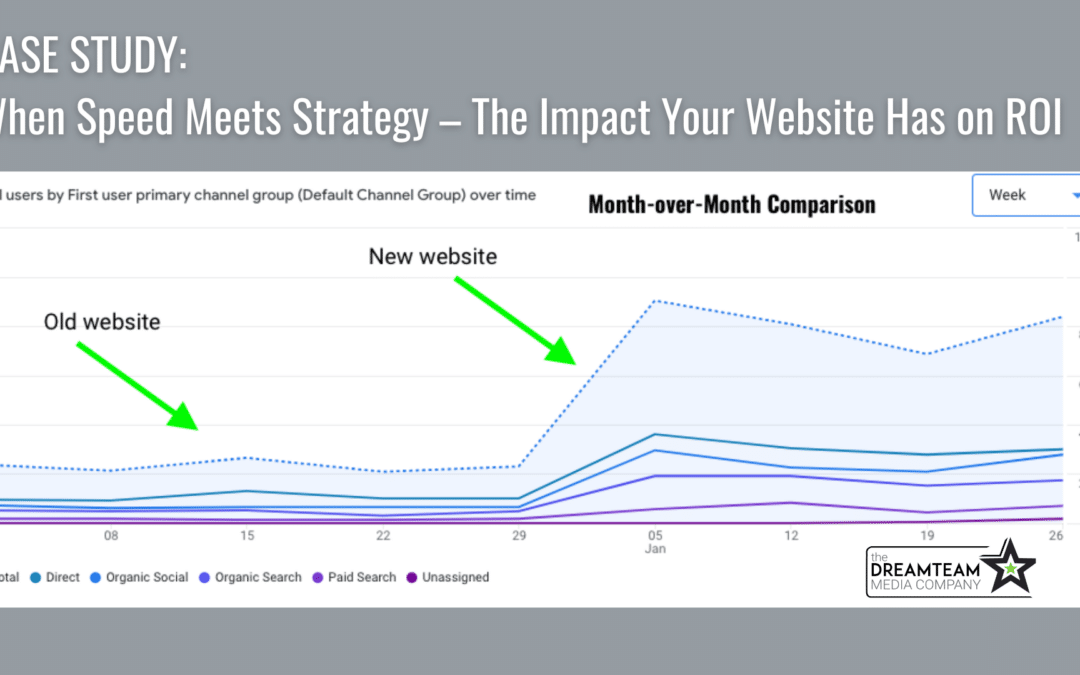
The Results of a Strategic Redesign
The new website drove an immediate 263% increase in total users. This increase compares total users in December 2024 to total users in January 2025, with no increase in ad spend.

Here is a simplified timeline of what happened:
- Feb 2024: Marketing services began.
- July 2024: Google Ads paused due to strong social engagement.
- Late July: Lead volume declined.
- August: Organic search traffic dropped.
- October: Website issues diagnosed (server/device compatibility).
- End of December: New website launched.
- January 2025: Massive traffic and engagement increases observed.
Here are the results with a new website from The Dream Team, without changing any other factors in their marketing.
263% increase in total users
558% increase in new users
204,245% increase in average engagement time per active user. *Note, this increase is from zero engagement in the previous month.
The Key Takeaway: Design and Inventory Feed Are Not Enough
A great-looking website that doesn’t load or convert is like a salesperson who never shows up for work. Here are some key metrics and tools to monitor your website’s performance.
- Page Speed Insights at pagespeed.web.dev is an online tool showing you how well your website performs in terms of speed, user experience, SEO, and compliance.
- Google Search Console is available to get updates and monitor your website’s performance from Google’s perspective.
- Google Analytics will show you which sources are driving traffic to your website. You want to see more organic traffic than paid traffic. If paid traffic is the largest driver of traffic, it could mean you are in a highly competitive market or your website is underperforming, requiring you to spend more money on ads.
Ready to upgrade your site from a digital brochure to a 24/7 lead generator?
Ready to Build Your Dream Website?
"*" indicates required fields